Houston SMB mobile PageSpeed benchmarks by industry — auto, HVAC, dental, restaurant, real estate.
We ran Google PageSpeed Insights against 97 top-ranked Houston small-business websites. The median one takes 11.9 seconds to load on a phone — nearly 5× Google's recommended bar — and 97% fail Core Web Vitals. Here's the full benchmark, by industry, and the fixes that move the needle most.
In June 2026 we pulled the top-ranked Google listings for five Houston searches — "used car dealer Houston TX," "HVAC repair Houston TX," "dentist Houston TX," "restaurant Houston TX," and "real estate agent Houston TX" — took the real website attached to each listing, and ran it through Google PageSpeed Insights on mobile.
97 sites pulled. 92 returned valid results (five threw server errors mid-test). These aren't cherry-picked bad sites — they're the businesses already ranking at the top of Google for their category. The data is brutal.
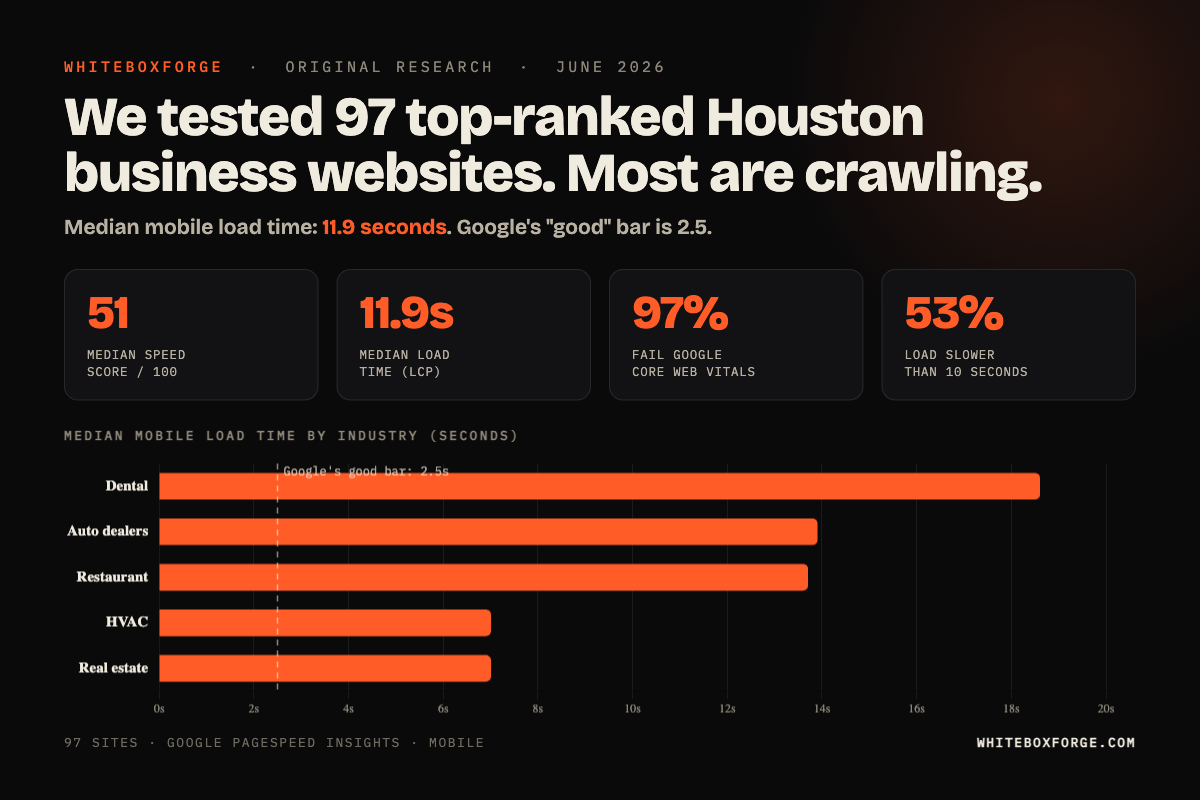
The headline: the median site takes 11.9 seconds to load its main content on mobile. Google's "good" bar is 2.5 seconds — only 3% of these sites clear it. 97% fail Core Web Vitals outright, and more than half take longer than 10 seconds to appear. The median PageSpeed score is 51 out of 100. The fixes are well-understood and cheap, and almost nobody in the dataset has done them.
- Median mobile load time (LCP): 11.9 seconds — nearly 5× Google's 2.5s "good" bar. Only 3% of sites clear it; 53% are over 10 seconds.
- 97% of sites fail Google's Core Web Vitals "good" threshold. Only 3 of 92 pass all three metrics.
- Median mobile PageSpeed score: 51/100. Only 5% score "good" (90+); 46% score "poor" (under 50).
- Real estate (median 62.5) and HVAC (61) scored best; dental (49) and auto dealers (47) worst. But even the fastest vertical loads in ~7 seconds — still ~3× Google's bar.
- The one bright spot is layout stability: median CLS is 0.007 and 80% of sites are "good" there. The problem is speed, not jank.
- The gap is enormous: the fastest 10% of sites average an 89 score; the slowest 10% average 21. Fast is achievable — most just haven't done the work.
Methodology
We collected the top-ranked business listings for each of the five Houston queries above via the Google Places API, then pulled the website attached to each listing. Businesses with no website — or with only a social or Yelp page — were excluded. That left 97 real websites; 92 returned valid results when run through Google PageSpeed Insights (mobile strategy, performance category) on June 13, 2026. Five sites returned server errors during testing and were dropped rather than guessed at.
For each site we captured the lab metrics PageSpeed reports: Performance score, Largest Contentful Paint (LCP), Cumulative Layout Shift (CLS), Total Blocking Time (TBT), and First Contentful Paint (FCP). All figures below are medians unless noted. This is a snapshot of top-ranked sites on a single date, not a longitudinal study — but the pattern is so lopsided that the conclusion is hard to miss.
Full benchmark results
Mobile PageSpeed score and load time by industry
| Industry | Sites | Median score | Median load (LCP) |
|---|---|---|---|
| Real estate (agents / brokers) | 20 | 62.5 | 7.0s |
| HVAC & home services | 20 | 61 | 7.0s |
| Dental | 15 | 49 | 18.6s |
| Restaurants | 19 | 48 | 13.7s |
| Auto dealers | 18 | 47 | 13.9s |
| All sites | 92 | 51 | 11.9s |
Two things stand out. First, the "best" verticals still aren't good: real estate and HVAC top the table on score, but their median site takes about 7 seconds to load on mobile — roughly 3× Google's bar. Second, score and load time don't move together. Dental posts a middling median score (49) but the worst load times in the study (18.6s), because dental sites pile on large, unoptimized image galleries that wreck LCP even when the rest of the page is light.
Core Web Vitals: where sites pass and fail
| Metric | Median | Google "good" bar | % of sites "good" |
|---|---|---|---|
| Largest Contentful Paint (load) | 11.9s | <2.5s | 3% |
| Total Blocking Time (responsiveness) | 355ms | <200ms | 35% |
| Cumulative Layout Shift (stability) | 0.007 | <0.1 | 80% |
| All three (pass Core Web Vitals) | — | — | 3% |
The story is narrow and clear: these sites are slow, not unstable. Layout stability is mostly fine — 80% of sites are "good" on CLS. It's load time, and to a lesser extent responsiveness, that fail. 90% of sites are past Google's 4-second "needs improvement" line on LCP; 53% are over 10 seconds.
The biggest predictor of a fast Houston SMB site isn't budget. It's restraint — fewer heavy images, fewer scripts, fewer widgets.
Why these sites are so slow
PageSpeed reports a score and a load time, not a diagnosis. But a median mobile LCP of 11.9 seconds almost always traces back to the same short list of causes — the same ones that separate the fastest 10% of sites in this study (average score 89) from the slowest 10% (average 21). In our build work, three patterns explain most of that gap.
1. Unoptimized hero images
The most common cause of a slow LCP is a hero image far larger than it needs to be — a 1.5–4MB JPEG or PNG where a properly sized WebP or AVIF under ~200KB would look identical. On a throttled mobile connection, that one file can add several seconds before the visitor sees anything. Fast sites serve a right-sized hero in a modern format with a fetchpriority="high" hint.
2. Too many third-party scripts
Every third-party origin — analytics, chat widgets, review carousels, retargeting pixels, embedded video, font services — adds DNS, TLS, and request overhead, and many block rendering. The usual offenders: a tag manager firing five pixels, a live-chat widget loading on every page, an embedded YouTube hero, and a reviews carousel pulling from BirdEye or Podium. Fast sites keep the third-party list short and defer what isn't critical.
3. Heavy or blocking web fonts
Custom web fonts loaded incorrectly are a quiet LCP killer. Three or four weights of two different families pulled in via blocking @import rules delay text rendering. Fast sites use the system font stack, or a single web font with font-display: swap and proper preloading.
The three fixes that move the needle most
Fix 1: Optimize the hero image
Take your hero image and run it through Squoosh, ImageOptim, or a one-line ImageMagick command. Export as WebP at roughly quality 75, sized for the dimensions it actually renders at (about 1600px wide for desktop, 800px for mobile via <picture>). Add fetchpriority="high" to the img tag, and explicit width and height attributes to prevent layout shift. For most slow sites this is the single biggest mobile win, and it usually takes minutes, not hours.
Our piece on why your Houston SMB website is slow walks through the hero-image fix step by step.
Fix 2: Audit third-party scripts
Open your site's source and find every <script src="..."> that points to an external domain. For each one, ask:
- Does this script need to load on every page, or just specific ones (cart, contact, etc.)?
- Does it need to load before page render, or can it be deferred?
- Is it actually still in use? (A surprising number of sites still load chat scripts from a vendor they switched off years ago.)
Remove what's dead. Defer the rest with defer or async. Move analytics to load after first paint. Lazy-load the chat widget on user interaction, not on page load.
Our piece on 3 automation traps wasting Houston SMB money covers the same "we installed a widget five years ago and forgot about it" pattern.
Fix 3: Simplify font loading
If you use a web font, use one. One family, one or two weights, loaded via <link rel="preload" as="font"> with font-display: swap. Drop the rest. Better yet, use the system font stack — on a phone the difference is invisible to almost everyone and costs nothing to load.
The combined impact
Done together, these three fixes typically move a poor mobile score into a much healthier range in a single focused day. Pushing from there to 95+ takes more invasive work — critical-CSS inlining, server-side rendering, an image CDN, edge caching — but the first pass captures most of the available conversion lift.
What page speed is worth
Two things ride on these numbers. The smaller one is ranking: Core Web Vitals are a confirmed Google ranking signal — modest, but real, and most decisive in close local-search races where competitors are otherwise similar. The bigger one is conversion. Published industry research has consistently found that as mobile pages get slower, visitors abandon them before they act — and a median load time of 11.9 seconds is squarely in abandonment territory.
Put plainly: most of the businesses in this study are paying — in ad spend, SEO, and referrals — to send phone traffic to a page that takes 10+ seconds to show up. A slow site quietly taxes everything else a business spends on marketing.
Notes by industry
Real estate & HVAC — best scores, still slow
These two verticals topped the score table (medians 62.5 and 61) and posted the fastest median load time in the study, about 7 seconds. That's the good news. The bad news is that 7 seconds is still nearly 3× Google's bar, so "best in Houston" is a low bar to clear. Real-estate sites that stumble do so on IDX/MLS embeds and lead-capture popups; HVAC sites usually on heavy Wix or Squarespace templates that ship megabytes of unused JavaScript.
Restaurants & auto dealers — slow and heavy
Restaurants (median LCP 13.7s) get buried under Toast, OpenTable, DoorDash, and BeyondMenu embeds — each a separate origin and 100KB+ of JavaScript. The fix is to lazy-load those widgets and link out instead of embedding. Auto dealers (13.9s) carry vehicle-inventory carousels, trade-in and financing widgets, and large lot photos; lazy-loading inventory below the fold and right-sizing photos is the highest-leverage move.
Dental — the worst load times in the study
Dental sites posted a middling median score (49) but the worst median load time of any vertical — 18.6 seconds — almost entirely from large hero videos (usually autoplaying, rarely useful) and bloated WordPress themes. Replacing the video with a single optimized photo and stripping unused theme assets is the move.
What to do this week
- Run your homepage through PageSpeed Insights on mobile. Take a screenshot. This is your baseline.
- Identify your hero image weight. Right-click, open in new tab, check file size. If over 300KB, that's the first fix.
- List every third-party script on your site. View source. Search for "src=". Count external domains. Anything over 4 is a leak.
- Check your font loading. If you have more than 2 font weights or more than 1 font family, you have a fix opportunity.
- Ship the three fixes. Re-run PageSpeed and compare against your baseline screenshot.
If you'd rather have someone else do the work, our 5-day Sprint covers all three fixes and ships a measurable score improvement before the next billing cycle. Or run our free 90-second audit first.
Frequently asked questions
What is a good Google PageSpeed score for a Houston SMB website in 2026?
For mobile, anything 90+ is competitive — but only about 5% of the sites we measured reach it. The median Houston SMB mobile PageSpeed score in our June 2026 benchmark was 51, across five industries (auto, HVAC, dental, restaurant, real estate). The bigger story is load time: the median site takes 11.9 seconds to render its main content on a phone. Real-estate and HVAC sites scored best; dental and auto-dealer sites were the slowest, weighed down by unoptimized image galleries and vehicle inventory.
What's the LCP (Largest Contentful Paint) target for SMB websites?
Under 2.5 seconds on mobile is the Core Web Vitals "Good" threshold. Across the 92 Houston SMB sites we successfully tested, only 3% hit it. The median LCP was 11.9 seconds, and 53% of sites took longer than 10 seconds to load on mobile. The usual culprits are large unoptimized hero images, render-blocking JavaScript, and heavy third-party embeds.
Why is mobile PageSpeed so much worse than desktop for Houston SMBs?
Mobile testing assumes a mid-tier device on a throttled connection. Sites built on heavy templates with multiple page builders, third-party scripts (live chat, review widgets, marketing pixels) and unoptimized images compound badly in that environment, so a site that feels fine on a desktop can score far lower on mobile — which is the test Google weights for local search.
What's the single highest-ROI page-speed fix for a Houston SMB?
Hero image optimization. Replacing an unoptimized hero image (often 1.5–4MB) with a properly sized WebP or AVIF under about 200KB is usually the single biggest mobile win, and it's typically a short fix with no design trade-off. Most of the slow sites in our benchmark simply hadn't done it.
Does PageSpeed score actually affect Google rankings or bookings?
Both. Core Web Vitals (LCP, INP, CLS) are confirmed Google ranking signals — modest but real, especially in close local-search races. The larger effect is on conversion: published industry research consistently finds that slower pages lose visitors before they act, and our benchmark shows most Houston SMBs are sending paid and search traffic to pages that take 10+ seconds to load on a phone.
How long does it take to fix Houston SMB PageSpeed scores?
The three highest-ROI fixes — image optimization, deferring non-critical scripts, and a lean font-loading strategy — can typically be shipped in a focused day and move a poor mobile score into a much healthier range. Getting to 95+ takes more invasive work (critical CSS, edge caching, server-side rendering), but the first pass captures most of the available gain.
Sources & further reading
- Why your Houston SMB website is slow — and the 1-day fix
- The 5 schema types that move the needle for Houston SMBs in 2026
- 5 conversion killers on Houston SMB websites
- 3 automation traps wasting Houston SMB money
- Run a free 90-second audit on your site
- Methodology: Google PageSpeed Insights (mobile strategy), web.dev Core Web Vitals docs, Google Places API. Benchmark run June 13, 2026.